



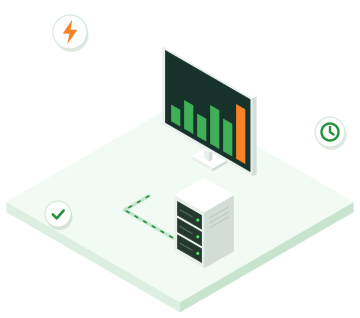
Monitoring: load graphs of a server and a reported alert

Metrics for every VM

Open a VM in the portal: its graphs cover the last hour, 6 hours, 24 hours or 7 days. They show CPU and memory usage, network traffic, disk space used and the counters of its firewall, rule by rule.

Measurements are collected by the hypervisor every 15 seconds: no agent to install in the VM, nothing that uses its resources.

Your organisation's alerts

The portal's Monitoring page lists the alerts that concern you: a replica lagging behind on your business continuity or disaster recovery plan, load balancer members down, a VPN cut, an autoscaling group at its maximum, sources blocked by the firewall.

They can also be read through the API, to connect them to your own tools.

A public status page

The portal's status page, available without logging in, shows the state of the platform and is updated every minute.

A platform watched by our engineers

Behind your dashboards, our engineers watch the platform itself: hypervisors, storage, network, replications. The logs of every server are centralised, and a read-only AI agent reports anomalies: only an engineer decides on actions.

Monitoring

At a glance

Collected every 15 seconds

By the hypervisor, with no agent in the VM.

Graphs over 7 days

1 hour, 6 hours, 24 hours or 7 days, in the portal.

Firewall counters

Packets and connections, rule by rule.

Alerts

Replicas, load balancers, VPN, autoscaling and firewall.

Status page

Public, updated every minute.

Through the API

Metrics and alerts in your own tools.

Process

How it works

Step 1

Open your VM

Metrics tab, in the portal.

Step 2

Choose the period

From one hour to seven days.

Step 3

Follow your alerts

On the Monitoring page, or through the API.

Frequently asked questions

Good to know

No. Measurements are taken by the hypervisor, outside the VM: nothing to install, and none of the VM's resources are used. To follow your applications from the inside, you remain free to install your own tools.

Seven days, viewable over periods of one hour, 6 hours, 24 hours or 7 days.

Your organisation's alerts are shown on the portal's Monitoring page and can be read through the API. For an incident on the platform itself, our engineers step in without waiting for your call.
PYSOFT Cloud

The other services in your VDC

How the PYSOFT cloud works

The PYSOFT cloud combines proven building blocks (OpenBSD, KVM, etcd, pf, relayd) around simple, auditable code. The goal: to offer …

Your virtual data center (VDC) in Algeria

A VDC brings your entire infrastructure together in an isolated space: servers, networks, firewall, VPN, storage and load balancers. You …

Virtual servers hosted in Algeria

Virtual servers hosted in Dellys and billed in dinars: choose a predefined configuration or build your VM by the vCPU, …

Encrypted VMs, from disk to memory

Encrypt each VM's disk with AES-256 using a key unique to that VM, and its memory with the AMD processor. …

Appstore: your applications ready in minutes

Choose an application and a VM size: the platform takes care of the rest, from installation to HTTPS, including the …

Autoscaling: your servers follow the load

An instance group adds VMs when the load goes up and removes them when it goes back down. You pay …

Routed SDN network: private networks and public IPs

Each organization has its own network, isolated from the others at the routing level. Your VMs communicate with each other …

Firewall as a Service (FWaaS) based on pf

Every VM has its own firewall, applied on its interface by pf, OpenBSD's firewall. You get the fine-grained control of …